User guide
This website calculates the effect of changes to the Dutch national budget for 2027. You change expenditure and taxes. The website then shows the effect on the deficit and on the national debt. You do not need knowledge of economics.
How to use this guide. The screenshots have orange numbers. Below each screenshot, the steps have the same numbers. Do the steps in this sequence.
This guide uses ASD-STE100 Simplified Technical English. The names of buttons and fields are in bold. They are the same as the names on the screen.
NOTE: This website does not give an official calculation from the CPB (Netherlands Bureau for Economic Policy Analysis) or the Ministry of Finance. The results are estimates from open data.
Contents
- Words in this guide
- Start
- The menu
- The dashboard
- Change the budget
- Compare two scenarios
- Share a scenario
- The Budget assistant
- Parliamentary papers
- Party programmes
- Sign in
- Pro: the workbench
- Pro: save and compare scenarios
- Pro: import a document
- Pricing and your account
- Questions and problems
1. Words in this guide
This guide uses each word with one meaning only.
| Word | Meaning |
|---|---|
| Slider | A control that you move to the left or to the right. |
| Scenario | Your version of the budget, with your changes. |
| Baseline | The budget without changes, as in the Budget Memorandum 2027. |
| Deficit | The government spends more money than it gets. The screen shows this as EMU balance. A minus sign shows a deficit. |
| Debt | All the money that the government borrowed. The screen shows this as EMU debt. |
| GDP | The value of all that the Netherlands produces in one year. The deficit and the debt are percentages of GDP. |
| 3 % limit | The European Union (EU) limit for the deficit: 3 % of GDP. |
| Signal value | A Dutch warning level for the deficit: 2 % of GDP. |
| 60 % limit | The EU limit for the debt: 60 % of GDP. |
| Engine | The calculation program on our server. It checks all figures. |
| bn | Billion euro. |
2. Start
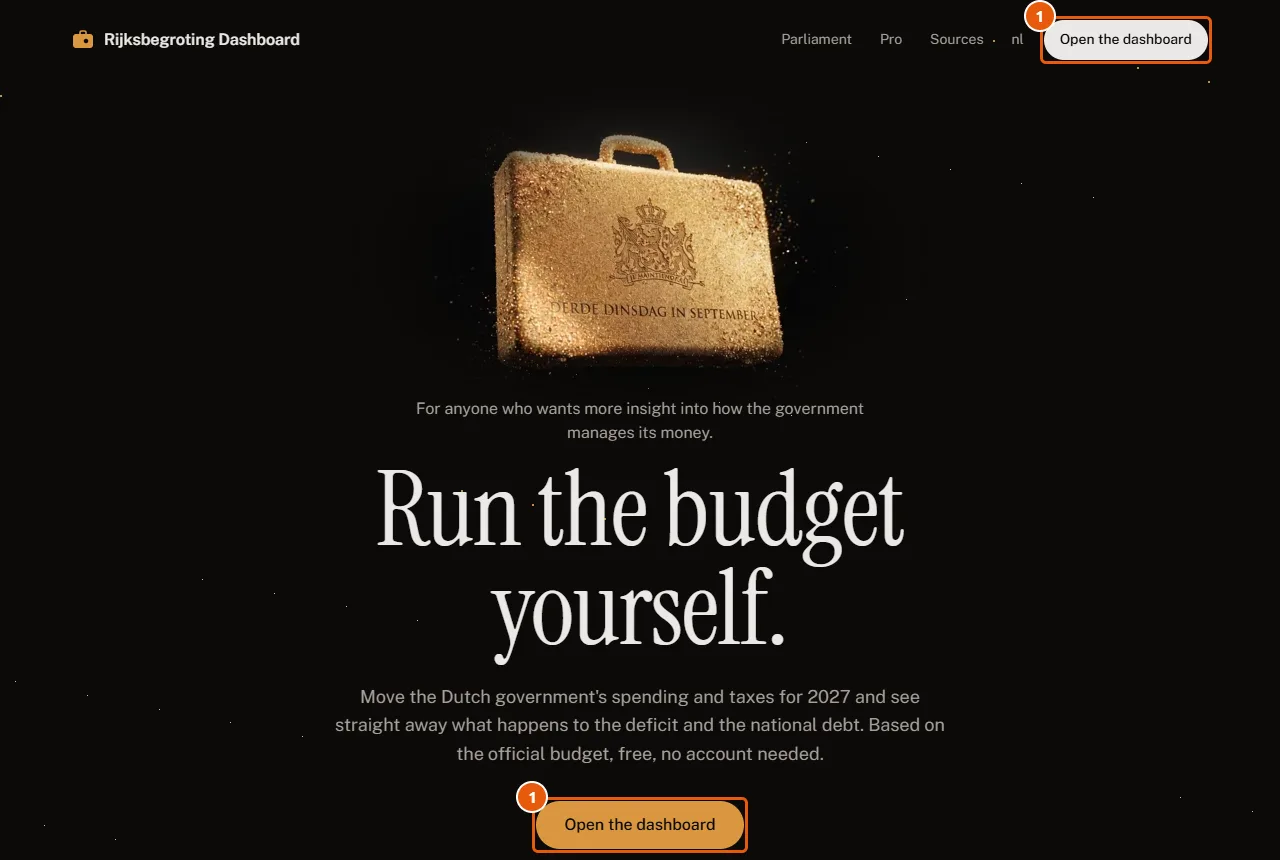
- Click Open the dashboard. The page has two of these buttons. They do the same thing.
You do not need an account. The dashboard is free.
The start page also has two items that you can use without the dashboard. Scroll down to find them.
Try it fast: What would you do?
In this item, you select less money, the same money or more money for three topics. The result shows immediately.
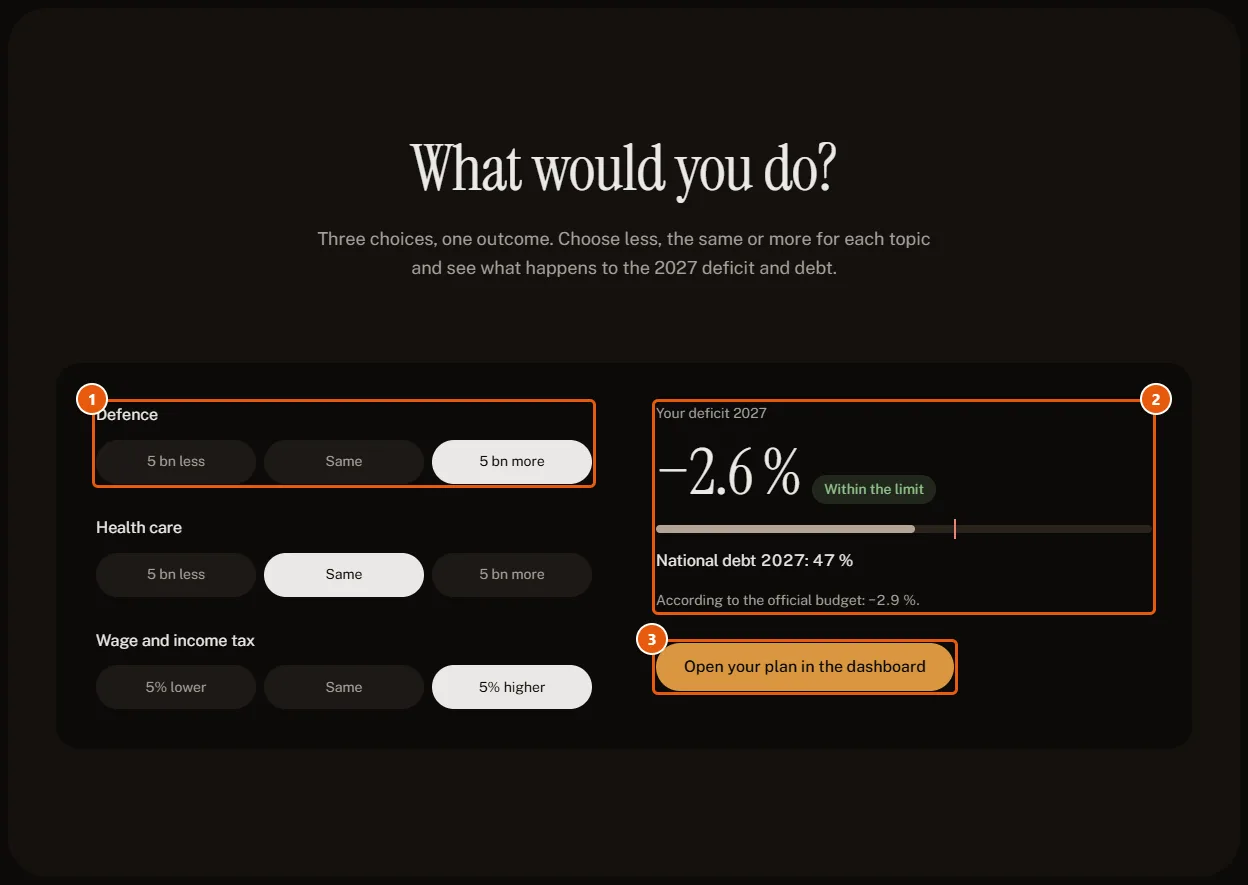
- For each topic, click one option. For example: 5 bn more for Defence.
- Look at Your deficit 2027. It also shows if the deficit stays inside the 3 % limit.
- Click Open your plan in the dashboard to continue with your selections.
NOTE: If you did not make a change, the name of the button is Open the dashboard.
Where do your taxes go?
This item shows how your tax money divides across the expenditure of the national government.
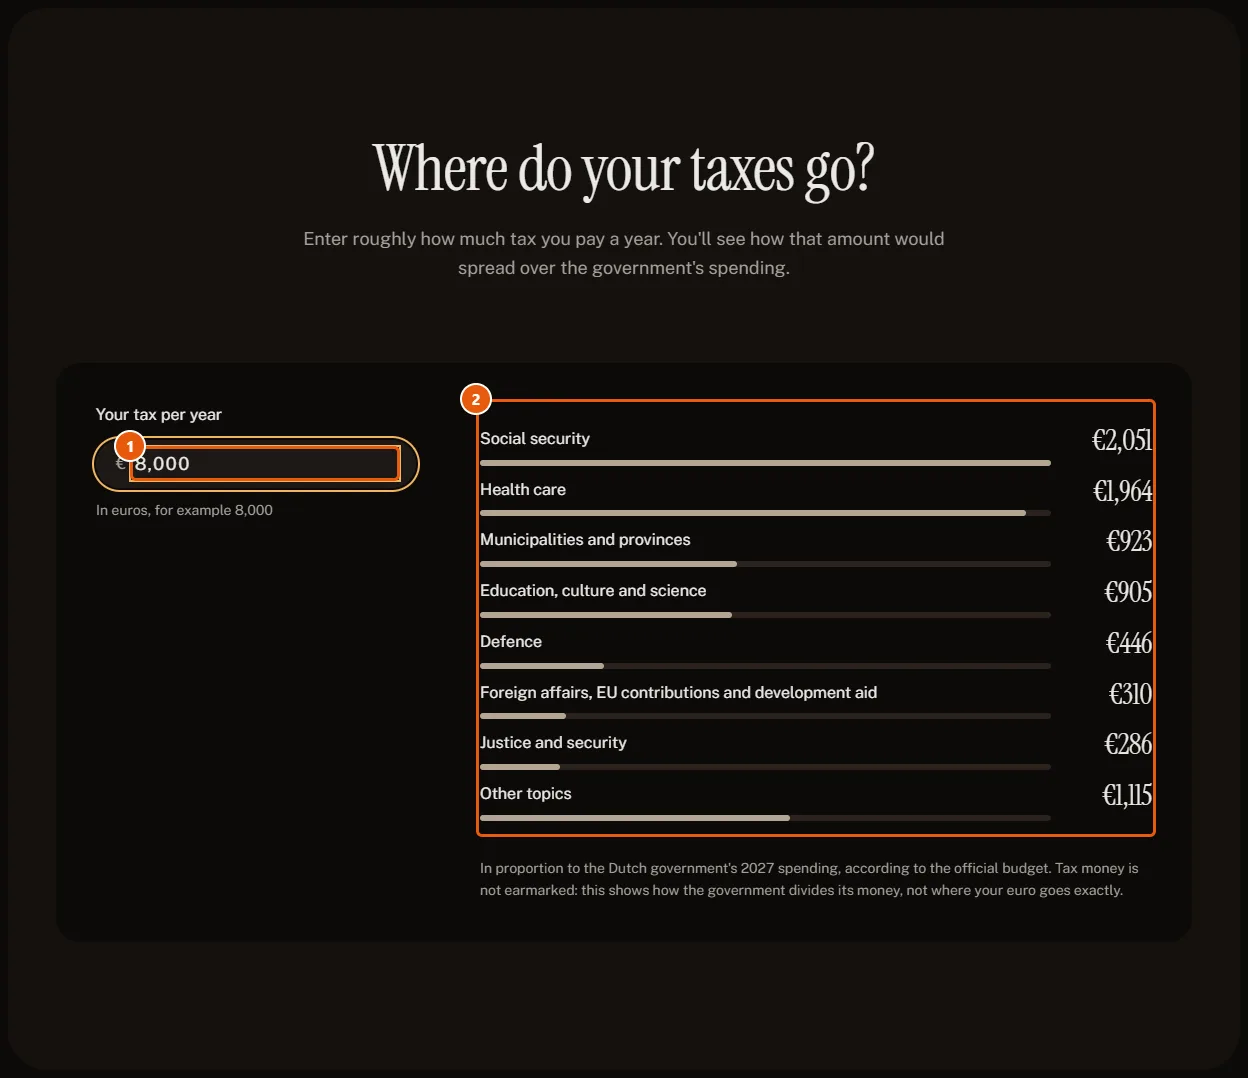
- In Your tax per year, type the approximate amount of tax that you pay. For example: 8,000.
- Look at the list. For each topic, it shows the amount in euro.
NOTE: This is an example calculation only. Tax money does not go to one specific topic. The list shows how the government divides all its money.
3. The menu
The menu is a narrow bar with icons. On a computer, the bar is on the left side. On a phone, the bar is at the bottom.
To see the name of an icon, put the mouse pointer on the icon.
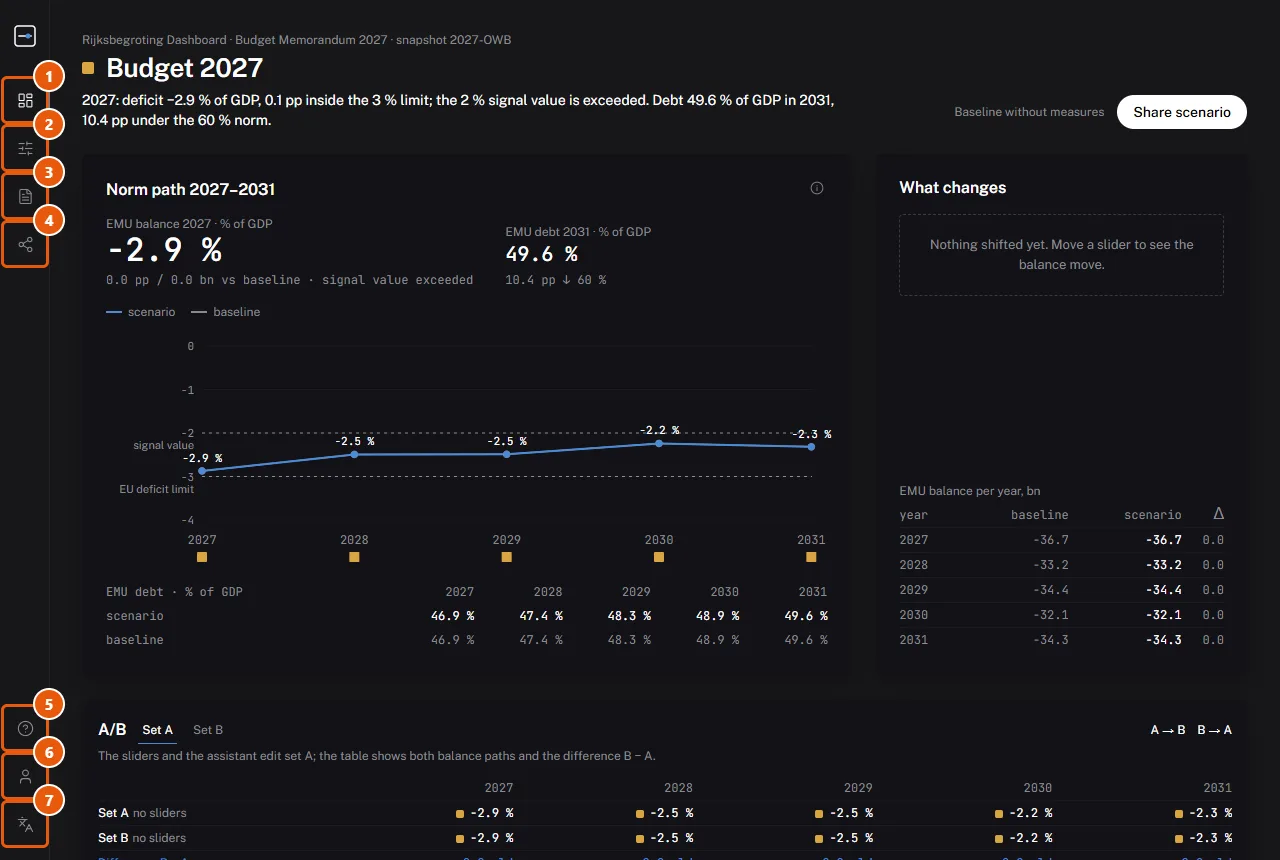
- Overview opens the dashboard.
- Pro opens the workbench for subscribers.
- Parliamentary papers opens the proposals of the House of Representatives.
- Share scenario makes a link to your scenario.
- User guide opens this page.
- Sign in opens the sign-in page. After you sign in, the name of this button is Account.
- The language button changes the language to Dutch or English.
Below Parliamentary papers there is also the button News. It opens the latest news about the budget.
4. The dashboard
The top of the dashboard shows the condition of the budget.
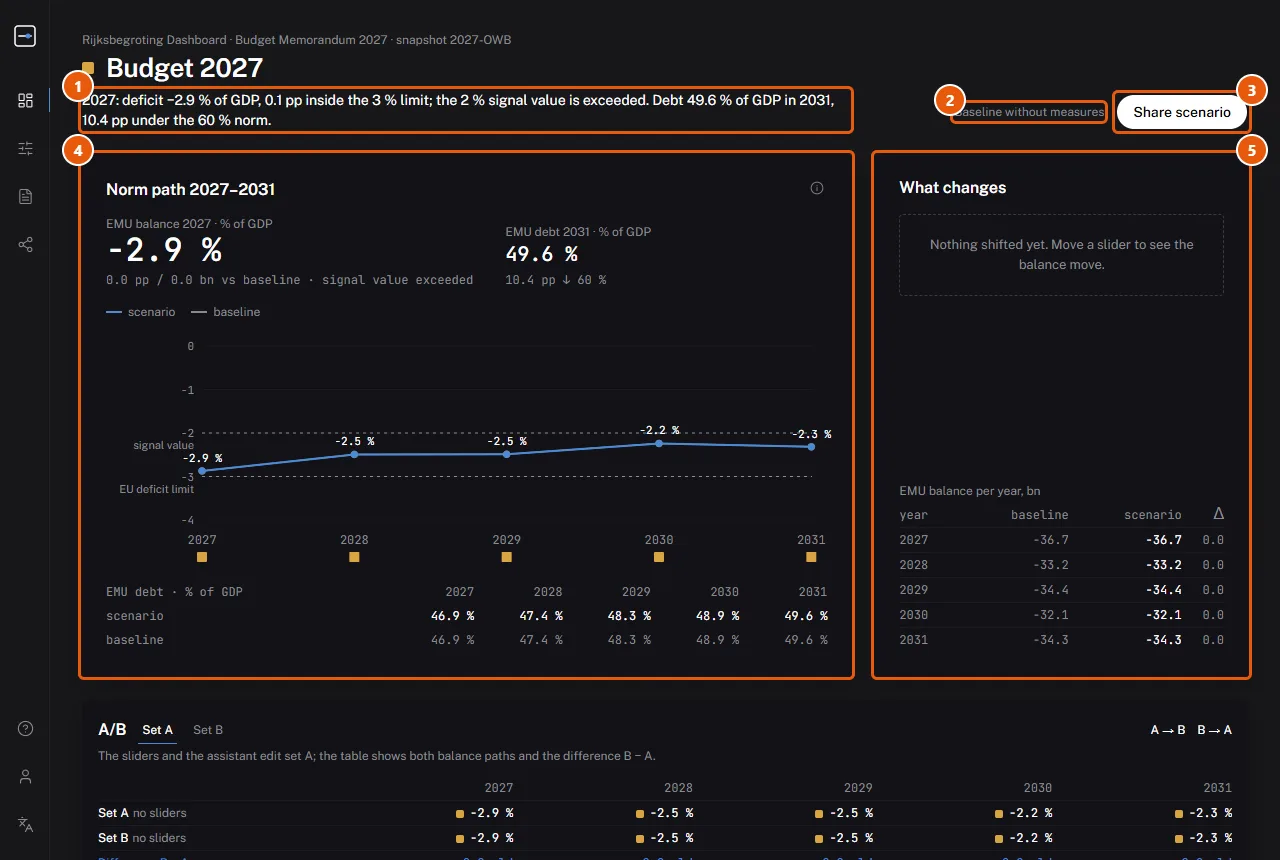
- The first sentence gives the deficit. It also gives the difference between the deficit and the 3 % limit.
- The status shows if the engine checked the figures. Refer to the table below.
- Share scenario makes a link to your scenario. Refer to Share a scenario.
- Norm path 2027–2031 shows the deficit for each year as a line. Refer to the list below.
- What changes shows all your changes. At this time, the list is empty.
How to read the Norm path chart:
- The blue line is your scenario. The grey line is the baseline.
- The top dashed line is the signal value of −2 %.
- The bottom dashed line is the EU limit of −3 %.
- Each year has a square below it. Yellow shows a small margin. Red shows that the deficit is more than the limit.
- The table below the chart shows the debt for each year.
The status messages:
| Status | Meaning |
|---|---|
| Baseline without measures | You did not make changes. |
| Preliminary: computed in the browser | Your computer made a fast estimate. |
| Engine confirming… | The engine checks the figures. Wait a few seconds. |
| Confirmed by the calculation engine | The engine checked the figures. This does not make them official. |
| Engine unreachable; preliminary figures | The engine does not operate at this time. You see the estimate from your computer. |
Below these items, the dashboard shows two more charts.
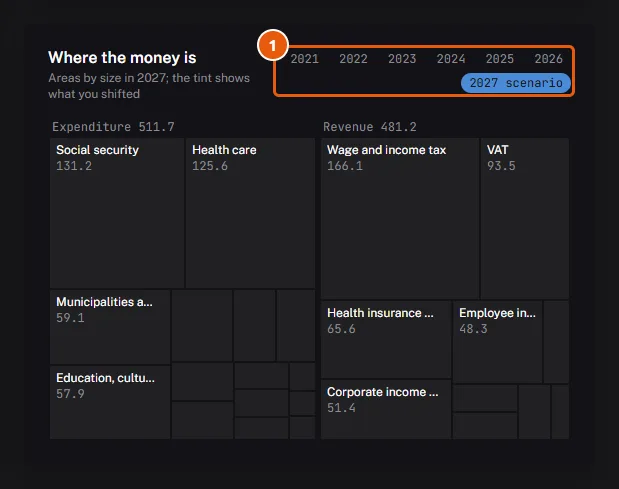
Where the money is shows each budget item as an area. A large area shows a large amount of money. The colour shows your changes.
- Click a year to see an earlier year. You can only look at earlier years. You cannot change them.
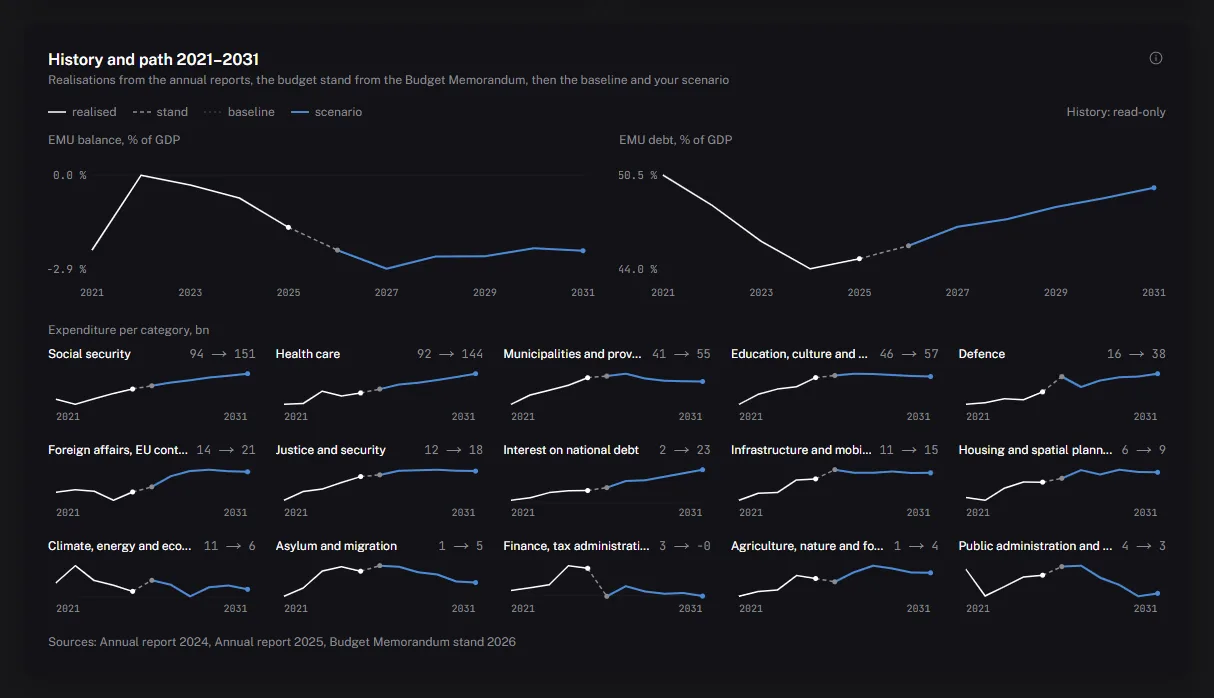
History shows the deficit, the debt and the expenditure of the past years. After these years, it shows the baseline and your scenario.
5. Change the budget
Below the charts, there are two groups of sliders:
- Expenditure: 15 sliders. Each slider changes an amount in billion euro for each year.
- Revenue: 10 taxes. Each slider changes a percentage of the tax income.
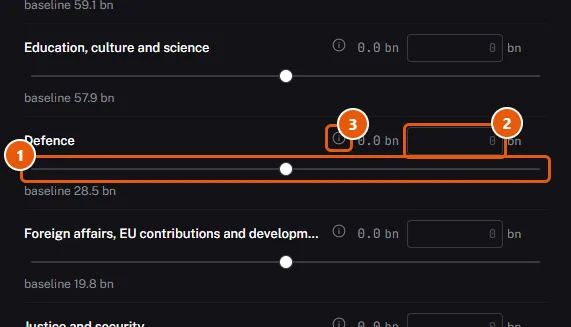
- Move the slider to the right to add money. Move it to the left to remove money.
- If the slider does not go far enough, type an amount in the field. Then push Enter.
- To see the source of the amount, click the i icon.
NOTE:
- The arrow keys on the keyboard move the slider in small steps.
- Click Reset to set one group back to zero.
- Click Reset everything at the top to start again.
The result of a change
In this screenshot, Defence has 10 billion euro more.
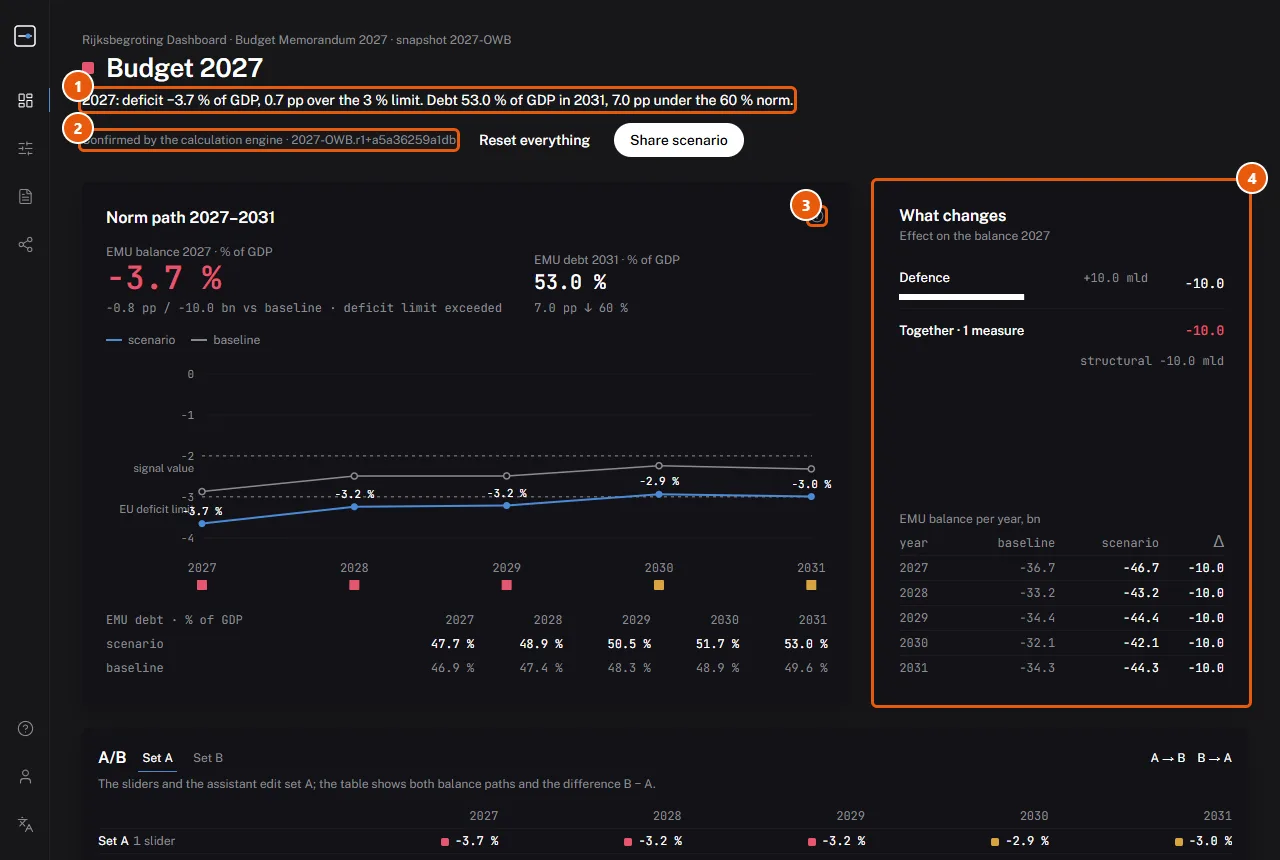
- The first sentence now shows that the deficit is more than the 3 % limit.
- The status now shows Confirmed by the calculation engine.
- The blue line is now below the grey line. The squares below 2027, 2028 and 2029 are red.
- What changes shows Defence with +10 bn. It also shows the effect for each year.
6. Compare two scenarios
To compare two scenarios, use the A/B block. This block is below the charts.

- Click Set A. Use the sliders to make your first scenario.
- Click Set B. The sliders now change your second scenario.
- Click A → B to copy scenario A to B. Then change only the items that must be different.
- Look at the table. The bottom row, Difference B − A, shows the difference for each year.
7. Share a scenario
A link is only available after you change one slider or more.
- Click Share scenario. This button is at the top of the dashboard and in the menu.
- Make sure that a window with a link opens.
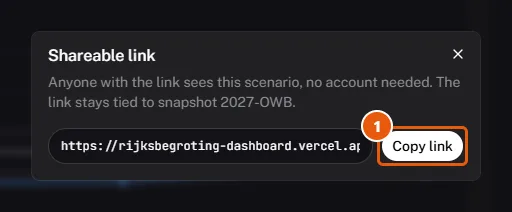
- Click Copy link.
- Paste the link into an email or a message.
All persons with the link can see your scenario. They do not need an account. The link does not show your name.
8. The Budget assistant
The assistant changes a request in usual words into slider settings. The assistant is on the dashboard, below the A/B block.

- Type your request in the field. For example: increase defence by 10 billion and pay for it with VAT.
- Click Ask.
- Read the proposal from the assistant.
- If the proposal is correct, click Apply to sliders.
- Click Apply to confirm.
NOTE:
- The assistant does not calculate. All figures come from the engine.
- If the assistant cannot prove a figure, you see a message instead of the answer.
- Sometimes the assistant asks a question first.
- The assistant does not give voting advice.
- Without Pro, you can ask 5 questions each day. With Pro, you can ask 100.
- Click New conversation to start again.
9. Parliamentary papers
In the menu, click Parliamentary papers. The page shows proposals of the House of Representatives about the budget: amendments, motions, notes of amendment and bills.
The website gets new papers two times each day: at 07:00 and at 19:00 (Amsterdam time).
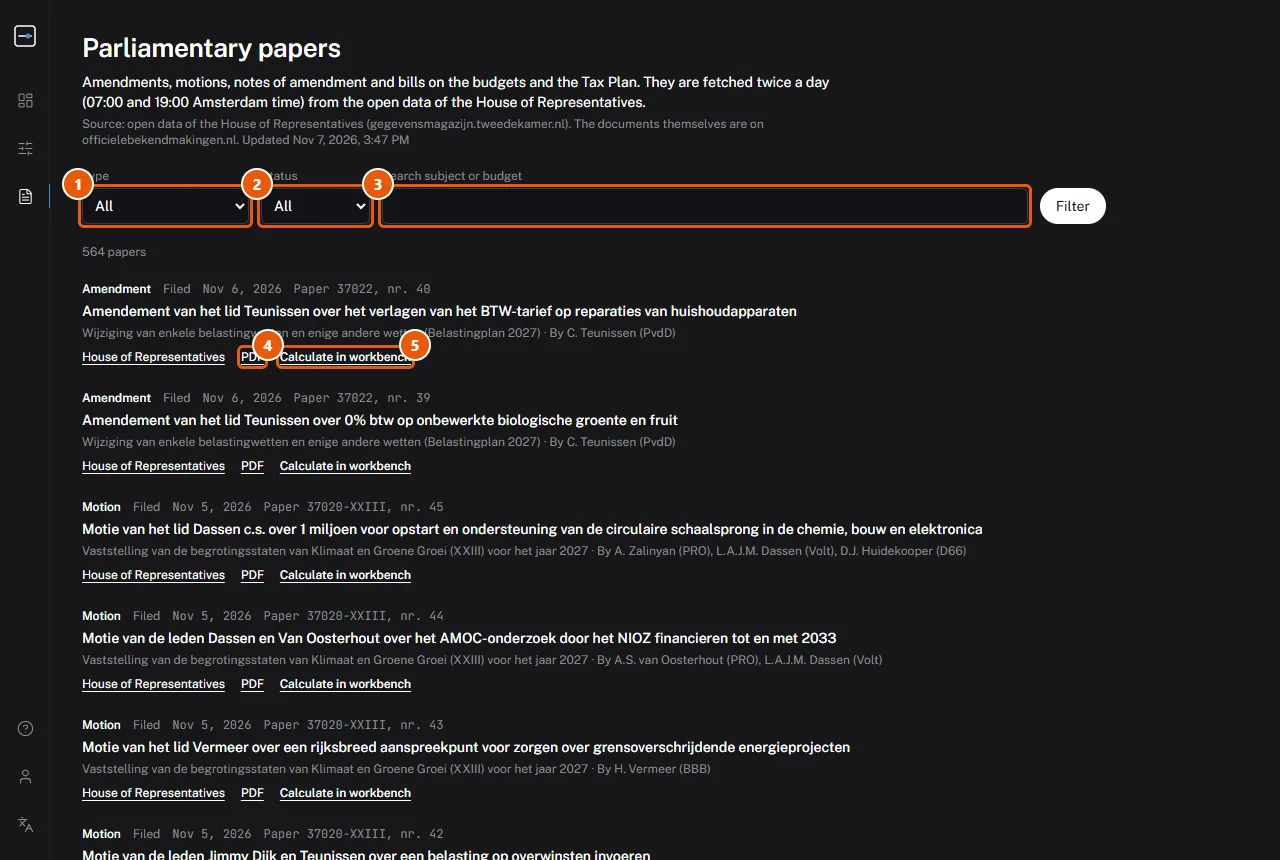
- Select a Type. For example: only motions.
- Select a Status. For example: Adopted.
- Type a subject in the search field. Then click Filter.
- Click PDF to read the paper. Click House of Representatives to open the page of the House.
- Click Calculate in workbench to see the effect of the paper on the deficit. This function needs Pro.
News about the budget
In the menu, click News. The page shows the twenty latest news items about the budget and the debate about it. The items come from NOS, Rijksoverheid.nl, CPB and the Netherlands Court of Audit. The headlines are in Dutch.
- Click a headline to open the full article at its source.
- The website gets new items each hour.
- A language model selects the items about the budget. Thus an item can be missing.
- Click To the archive to see older items. The archive shows them by month.
10. Party programmes
These pages are not available to all users yet. When they are available, the link is on the page About and disclaimer.
These pages show the parties in the House of Representatives. They show the seats of each party. They also show what the election programme of 2025 says about the budget.
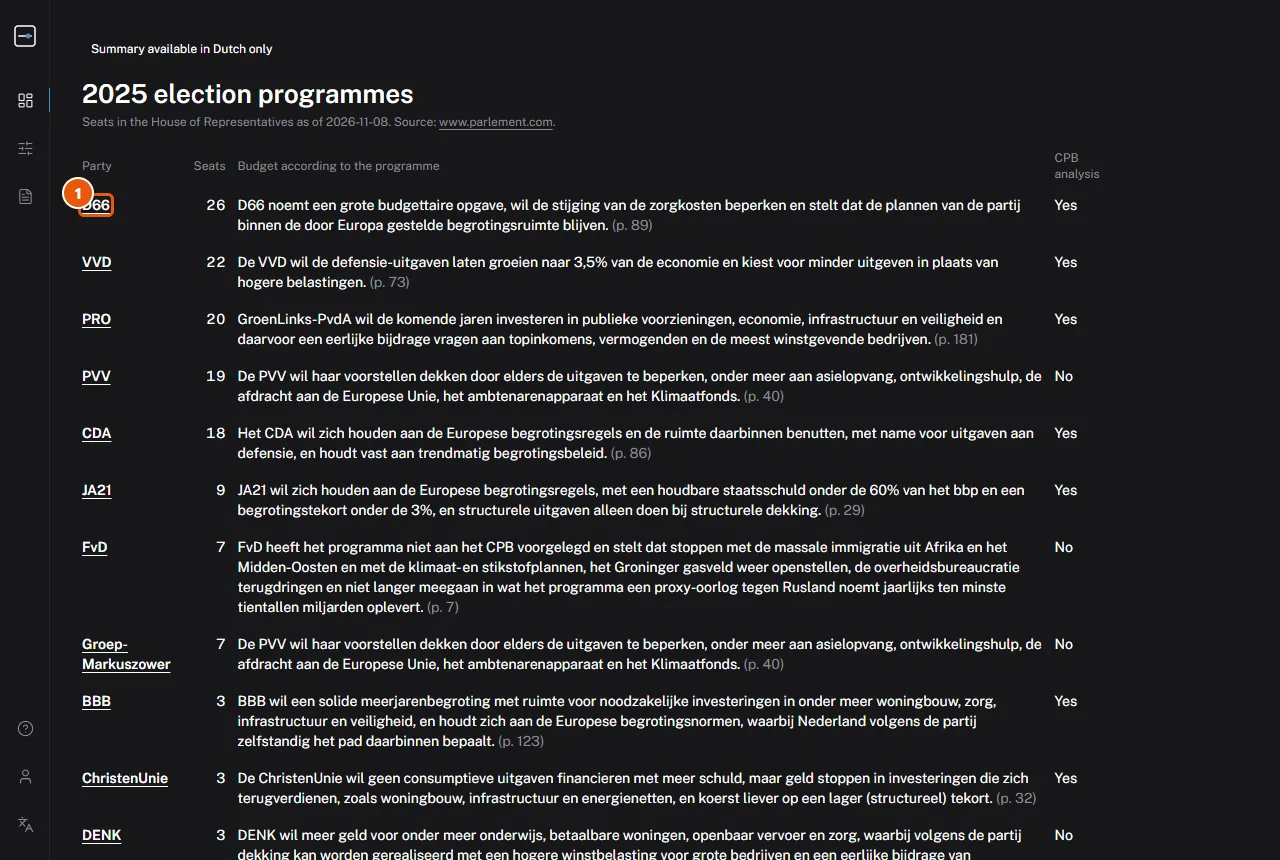
- Click a party to read more.
For each party, the page shows the main points and the largest measures. If the CPB calculated the programme, the page also shows the CPB figures from Keuzes in Kaart (Charted Choices).
Each sentence has a source with a page number. The editors of this website wrote the summary. The party did not write it.
NOTE: The text on these pages is in Dutch only.
11. Sign in
You must sign in only for Pro. In the menu, click Sign in.
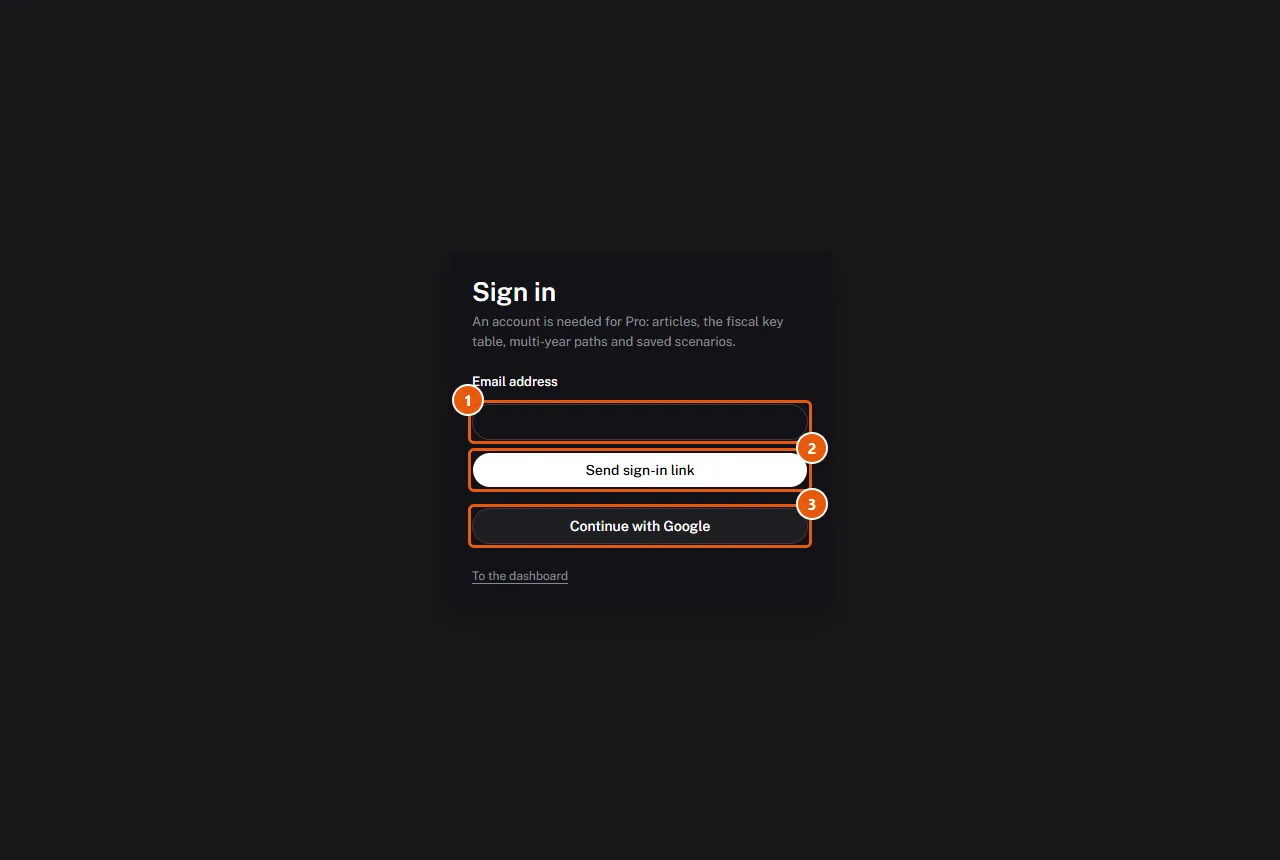
- Type your Email address.
- Click Send sign-in link. You get an email with a link.
- If you have a Google account, click Continue with Google. Then you do not do steps 1 and 2.
NOTE: For the link in the email:
- Open the link in the same browser that you used to request it.
- The link operates one time only.
- The link stops after one hour.
12. Pro: the workbench
Pro gives more calculation functions. You need an account and a subscription. In the menu, click Pro.
Pro gives these functions:
- 209 budget articles instead of 15 sliders. You can change items down to one scheme.
- 78 tax controls, for example rates and tax credits.
- More years: for each measure, you select the start year.
- Calculation with behaviour: persons and companies change their actions when taxes change. The workbench can calculate this effect.
- Checks of the budget rules: the workbench shows if you stay below the agreed maximum expenditure.
- Save, compare and download your scenarios.
Add a measure
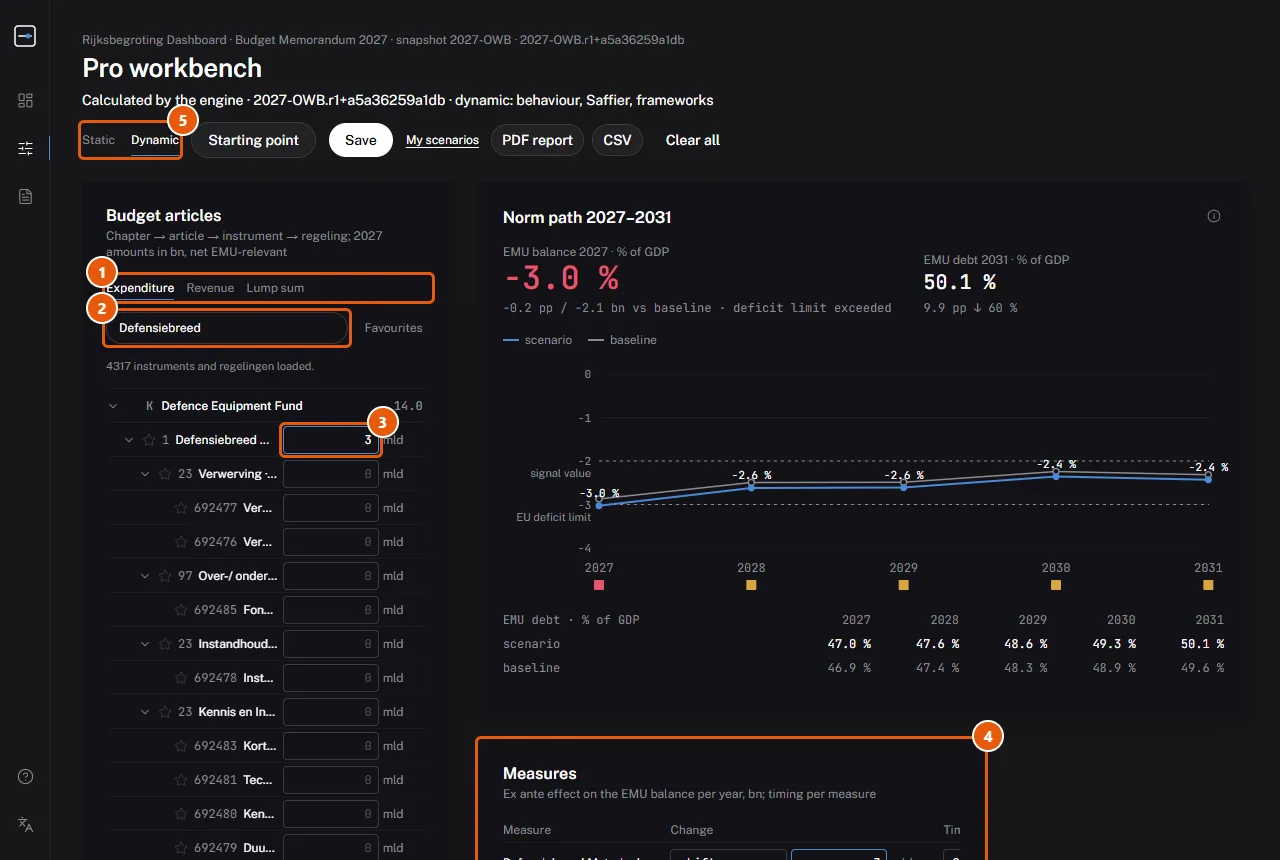
- Select a tab: Expenditure, Revenue or Lump sum.
- Type a subject in the search field. For example: Defensiebreed.
- Type an amount in billion euro in the field next to the row. Then push Enter.
- Look at Measures. Your measure is now in this list. The chart shows the new result.
- Select Static or Dynamic. Refer to the list below.
NOTE: The names of budget articles are in Dutch. Click the star in front of a row to add it to your Favourites.
Static or Dynamic:
- Static gives a simple calculation: 1 billion euro more expenditure gives 1 billion euro more deficit.
- Dynamic also calculates how persons, companies and the economy change. The result is usually a little smaller.
Change taxes
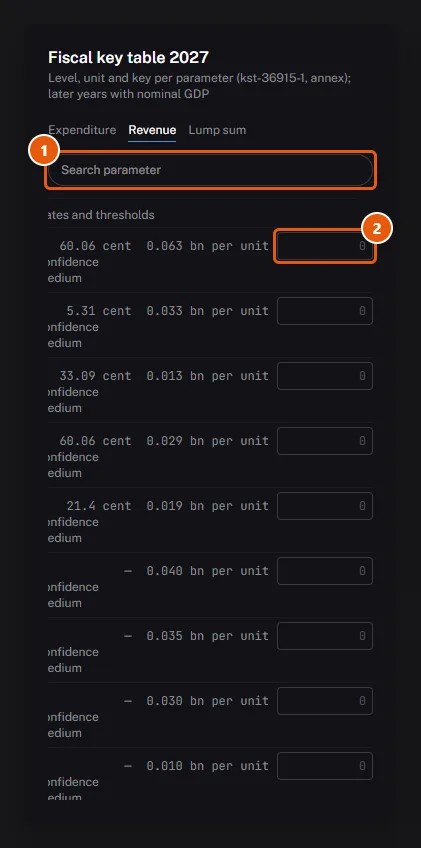
- Type the name of a tax or a tax credit in the search field.
- Type the change in the field. Then push Enter.
Each row shows the income or the cost of one unit of change.
Add new policy
To add an item that is not in the budget, use the Lump sum tab. For example: a new fund.
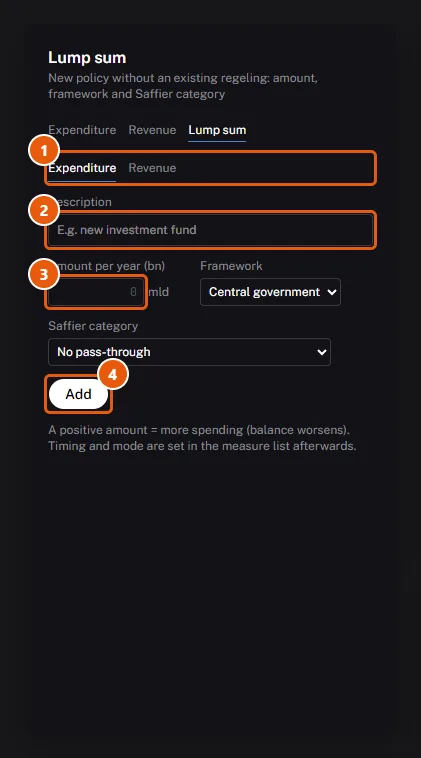
- Select Expenditure or Revenue.
- Type a Description. For example: new investment fund.
- Type the Amount per year (bn).
- Click Add.
Select when a measure starts
In Measures, you set how and when each measure operates.
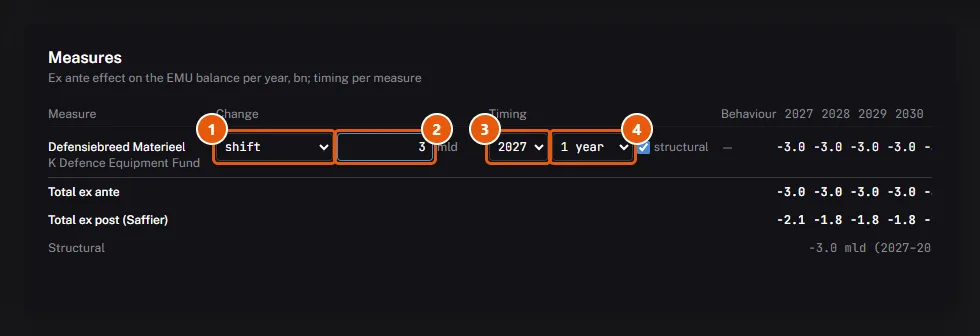
- Select the Mode. Refer to the list below.
- Type the amount or the percentage.
- Select the Start year. This is the year in which the measure starts.
- Select the Phase-in. This is the number of years until the measure has its full effect.
The modes:
- shift: you add an amount or you remove an amount.
- relative: you change the item by a percentage.
- target level: you type the amount that you want.
To remove a measure, click the cross at the right end of the row. If you cannot see the cross, scroll the table to the right.
Check the budget rules
First, click Dynamic. Then the block Framework checks and KiK scale opens.
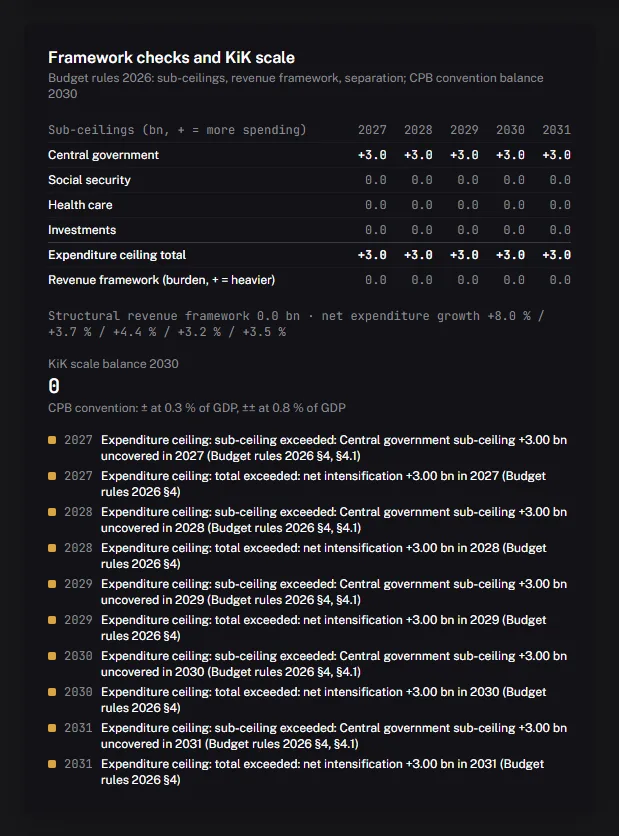
This block shows two items:
- If you stay below the agreed maximum expenditure. There are different limits for health care, social security, the central government budget and investments.
- The score of your scenario on the CPB scale. The CPB uses this scale in Keuzes in Kaart.
The buttons at the top

- Starting point: start with the package of a party or with one of your scenarios.
- Save: keep your scenario with a title.
- PDF report: download a report with all figures and sources.
- CSV: download the figures for a spreadsheet program.
- Clear all: start again.
Start from a starting point
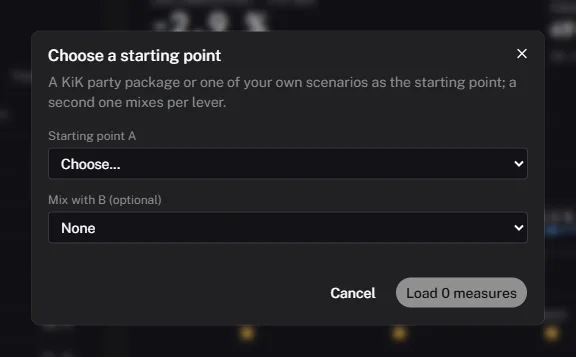
- In Starting point A, select a party or one of your scenarios.
- If you want to mix two starting points, select a second one in Mix with B (optional).
- Click Load … measures.
13. Pro: save and compare scenarios
- In the workbench, click Save.
- Type a Title.
- In the window, click Save.
Your saved scenarios are in My scenarios.
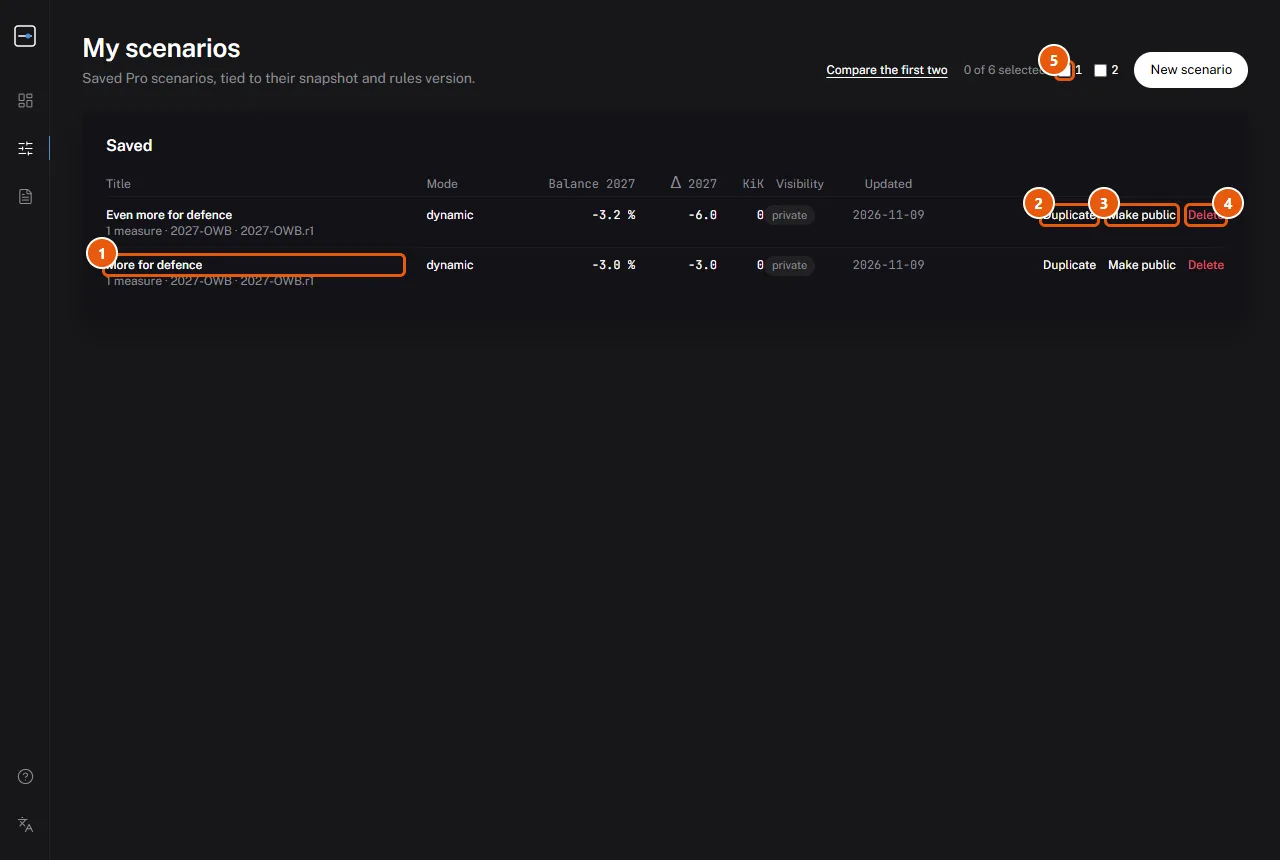
- Click a title to open the scenario.
- Click Duplicate to make a copy.
- Click Make public to let other persons see the scenario. Click Make private to stop this.
- Click Delete to remove the scenario.
- Put a tick next to two to six scenarios. Then click Compare to see them next to each other.
CAUTION: You cannot undo Delete. The scenario is removed permanently.
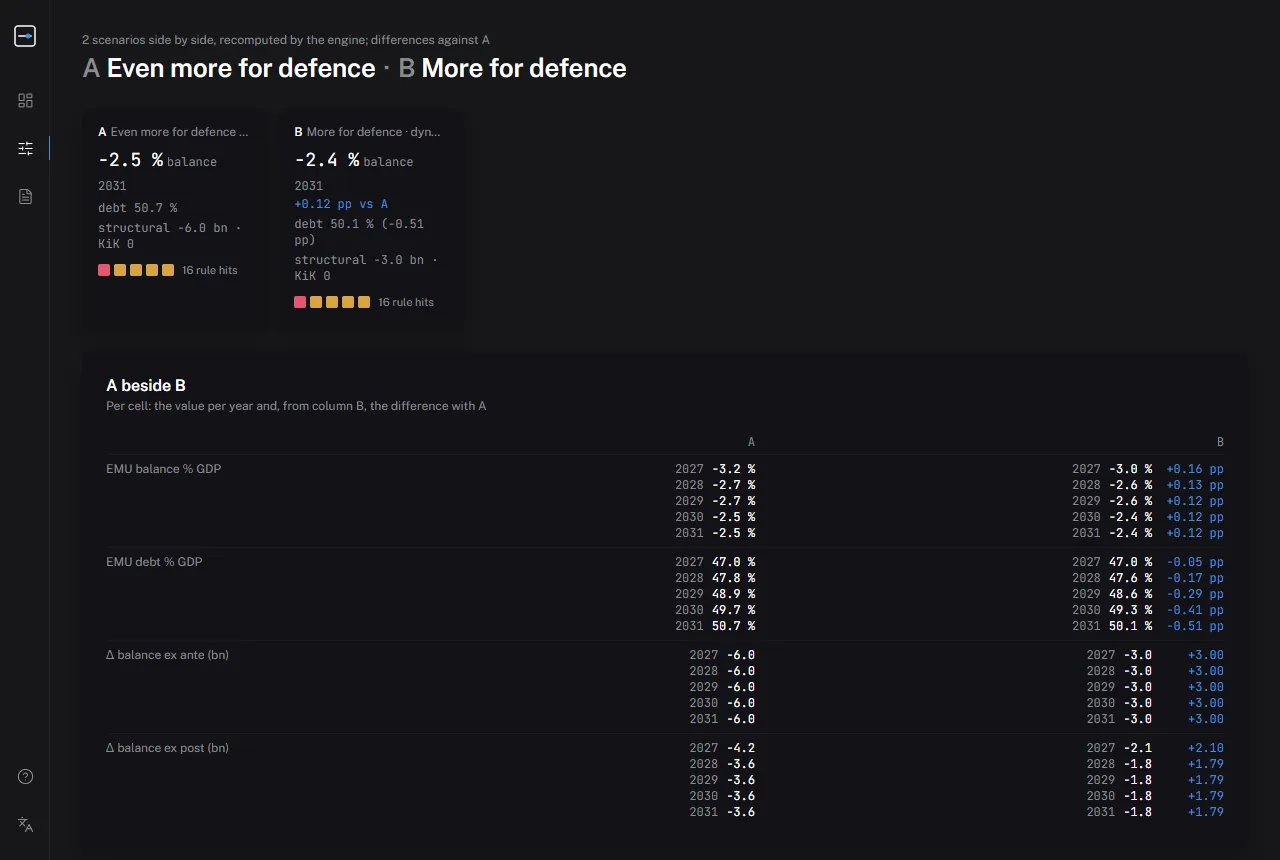
The comparison shows the deficit and the debt for each year. It also shows the difference from scenario A. You can ask the assistant to explain the difference.
Is there a new budget? For example, after the Spring Memorandum:
- Open your scenario.
- Click Recompute on latest budget.
- Save the new result as a new scenario.
Your old scenario does not change.
14. Pro: import a document
The assistant can read a document about the budget and find the measures in it. For example: a parliamentary paper, an amendment, a party programme or a coalition agreement. This block is in the workbench.

- Click Choose a PDF. Select the file on your computer.
- Click Upload PDF. Wait until the assistant is ready.
- Read the measures that the assistant found. Each measure shows its page number.
- Click Put … measures in the workbench.
- Click Apply to confirm.
The document must agree with these conditions:
- It is a PDF with real text. A scan does not operate.
- It is not larger than 20 MB.
- It has not more than 100 pages.
One document counts as 5 questions to the assistant. After 30 days, the website removes the document automatically.
15. Pricing and your account
At the bottom of a page, click Pricing.
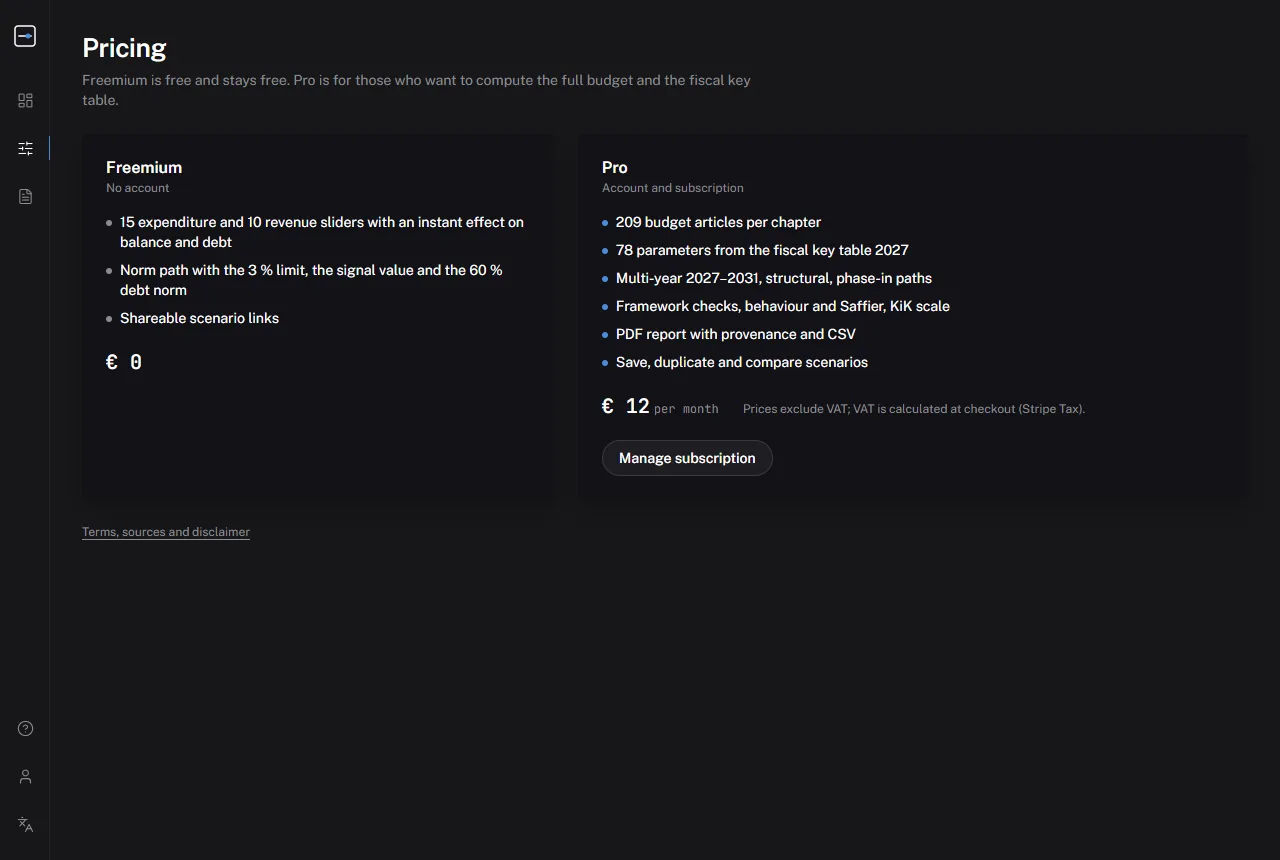
If you do not have Pro:
- Click Pro monthly or Pro yearly. These buttons are below the Pro block.
- Pay through Stripe.
- Wait a few seconds. If Pro does not operate, refresh the page.
If you have Pro: the page shows the button Manage subscription, as in the screenshot. Use this button to cancel your subscription. Use it also to change your payment details.
The prices do not include VAT.
After you sign in, click Account in the menu.
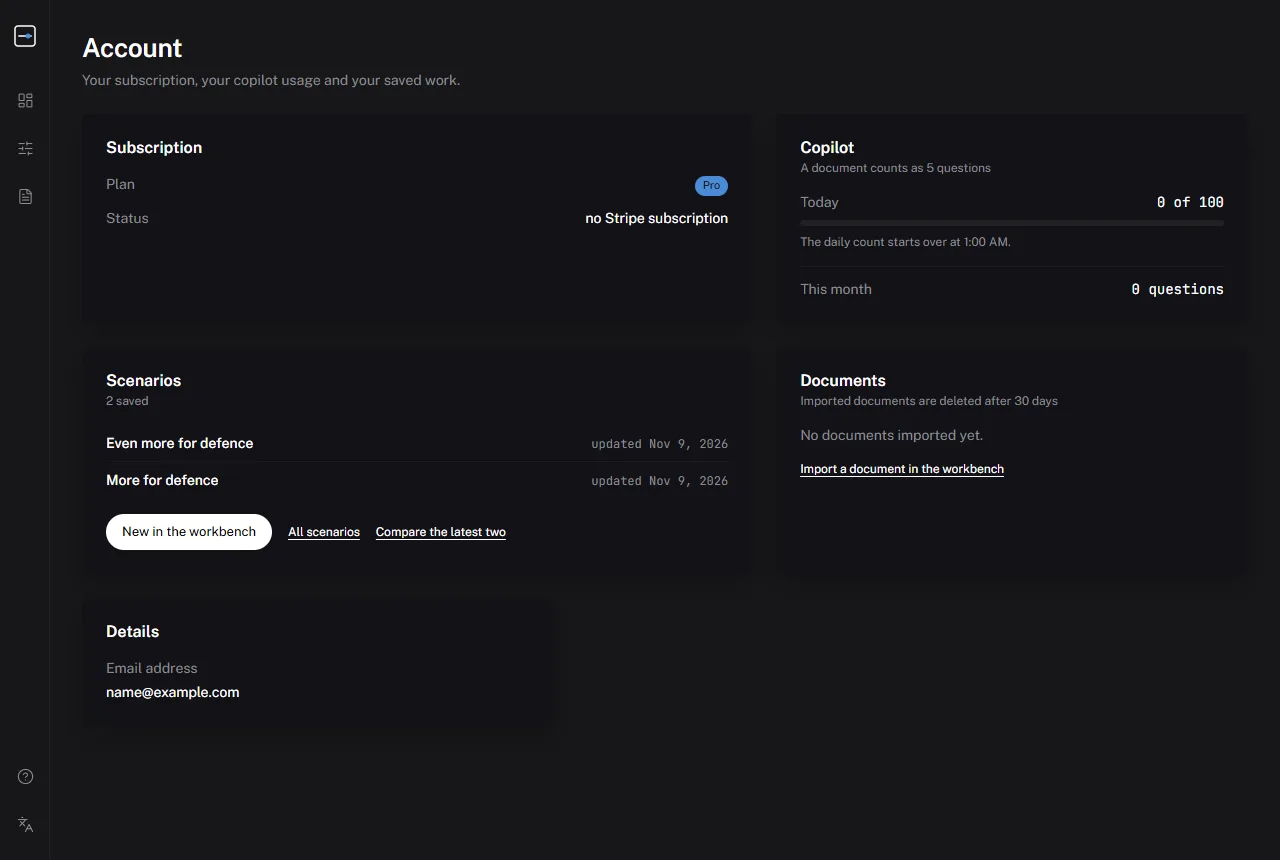
This page shows:
- your subscription;
- the number of questions that you asked the assistant today;
- your saved scenarios;
- your documents.
16. Questions and problems
Do I need an account? No. You need an account only for Pro.
Are the figures correct? The amounts come from the Budget Memorandum 2027. The free dashboard uses a simple calculation. It does not include changes in behaviour, effects on the economy or more interest on the debt. Each item shows how certain the amount is: high, medium or low.
Where do the figures come from? From rijksfinancien.nl, the House of Representatives, CBS (Statistics Netherlands), the CPB, Eurostat and the European Commission. All sources are on the page About and disclaimer.
What is Keuzes in Kaart? Before each election, the CPB calculates the programmes of the parties. We compare our calculation with the CPB calculation. The differences are in the KiK deviation report.
What do you do with my data? We count visitors without cookies. A link to a scenario contains only the settings of your sliders. Refer to the privacy statement.
If you see a message or a function does not operate:
| Message or problem | Action |
|---|---|
| Move a slider first to share. | Change one slider first. |
| Engine unreachable; preliminary figures | Try again later. Until then, you see an estimate. |
| The sign-in link does not operate | Request a new link. Open it in the same browser, not in the mail app on your phone. |
| Your daily number of questions is used up. | Try again tomorrow. With Pro, you can ask 100 questions each day. |
| Too many requests; wait a moment. | Wait one minute. Then try again. |
| The website cannot read my PDF | Use a PDF with real text. A scan or a protected file does not operate. |
| The PDF of this paper is not on officielebekendmakingen.nl yet | Try again tomorrow. A new paper is usually online after one day. |
| This scenario does not exist or has expired. | The link is for an old budget. This budget is not available now. |