For anyone who wants more insight into how the government manages its money.
Run the budget yourself.
Move the Dutch government's spending and taxes for 2027 and see straight away what happens to the deficit and the national debt. Based on the official budget, free, no account needed.
Open the dashboardNot an official calculation by the CPB or the Ministry of Finance. Indicative, based on open data.
Try it with the 2027 budget
Without extra money: −2.9 %. There are 24 more sliders in the dashboard.
Deficit 2027: −2.9 %of GDP, deficit 2027Within the limit
European limit −3%
What you can do with the budget
- Slide.
- Calculate.
- Compare.
- Follow Parliament.
- Share it.



Two limits from Brussels.
Europe asks that the deficit stays below 3% of GDP and the debt below 60%. This is where the Netherlands stands according to the 2027 budget, without new measures.
- 2027−2.9 %
- 2028−2.5 %
- 2029−2.5 %
- 2030−2.2 %
- 2031−2.3 %
- Deficit 2027
- −2.9 %
- Debt 2027
- 47 %
Five years ahead
You see every year from 2027 to 2031, not just the first.
Warned in time
The 2% signal value counts too, so you see when it gets tight.
Debt counts as well
Every deficit adds to the national debt. You see it move against the 60% limit.
What would you do?
Three choices, one outcome. Choose less, the same or more for each topic and see what happens to the 2027 deficit and debt.
Your deficit 2027
−2.9 %Within the limit
National debt 2027: 47 %
According to the official budget: −2.9 %.
Twenty-five sliders.One budget.
Fifteen spending areas and ten tax groups, each with its own slider. You see the effect at once; then the calculation engine confirms the numbers.
Social security
€ 131 bn
Health care
€ 126 bn
Municipalities and provinces
€ 59 bn
Education, culture and science
€ 58 bn
Defence
€ 29 bn
Spending and taxes
From healthcare and education to VAT and corporate tax. Type an amount when the slider does not go far enough.
Plan A next to plan B
Put two plans side by side and see the difference year by year.
Share with one link
Anyone can open your plan, without an account.
Where do your taxes go?
Enter roughly how much tax you pay a year. You'll see how that amount would spread over the government's spending.
In euros, for example 8,000
| Social security | €2,051 |
|---|---|
| Health care | €1,964 |
| Municipalities and provinces | €923 |
| Education, culture and science | €905 |
| Defence | €446 |
| Foreign affairs, EU contributions and development aid | €310 |
| Justice and security | €286 |
| Other topics | €1,115 |
In proportion to the Dutch government's 2027 spending, according to the official budget. Tax money is not earmarked: this shows how the government divides its money, not where your euro goes exactly.
Follow what Parliament wants.
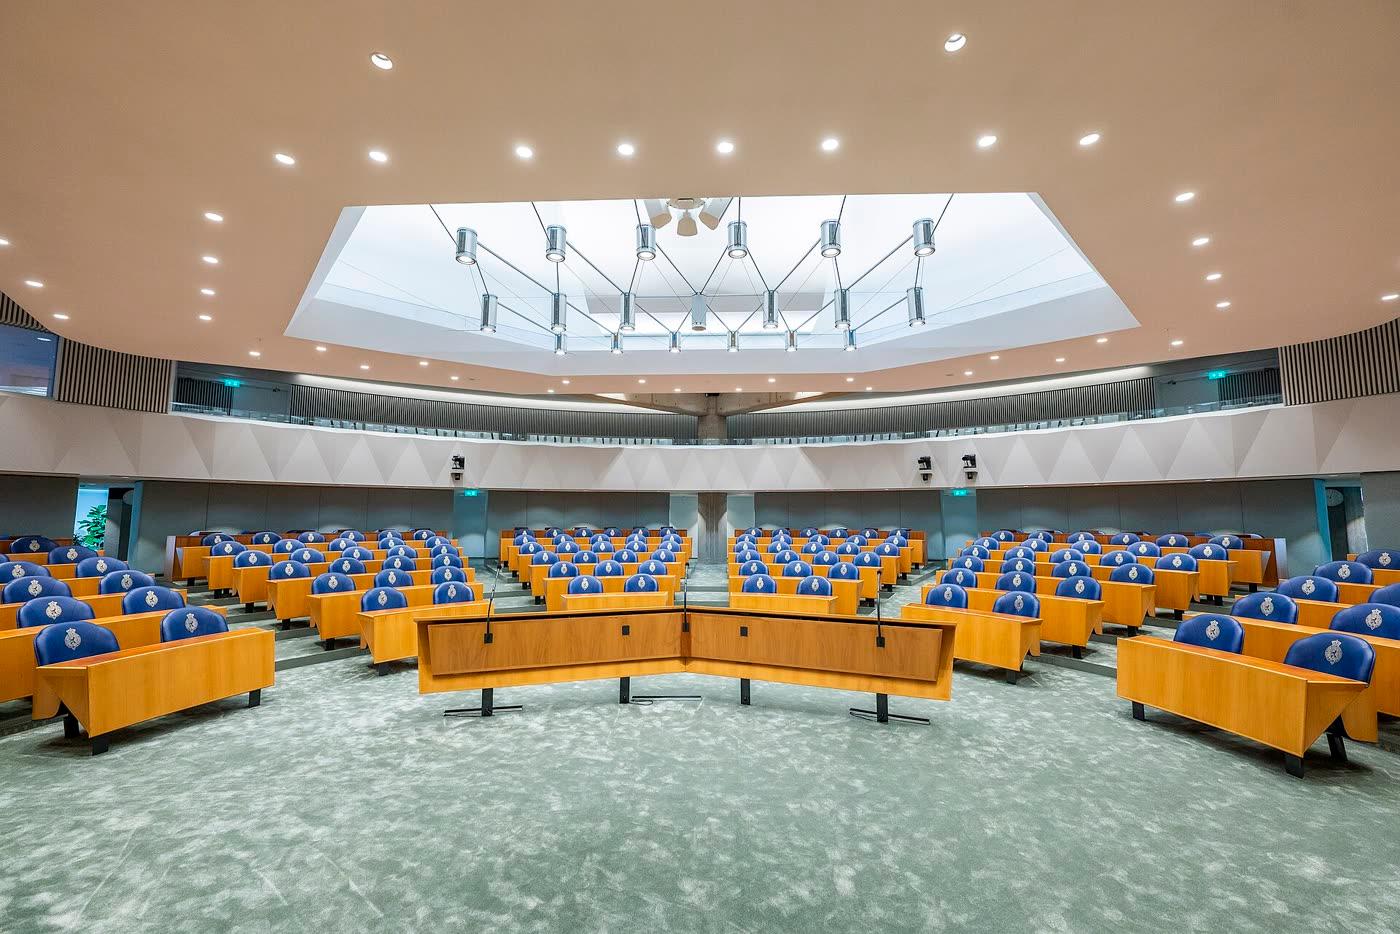
Amendments, motions and bills that cost or raise money, collected twice a day from the Tweede Kamer's open data.
Twice a day
New papers come in at 7:00 and 19:00, with their status.
Calculated in one click
See what an amendment does to the deficit, with its source.
Next to the CPB
In Pro, start from the party programmes in Keuzes in Kaart.

Open about what we do and don't know.
Calculating a budget is always an approximation. So we show where the numbers come from and what we leave out.
From the official budget
Every amount comes from the 2027 budget, through the open data of rijksfinancien.nl.
Fixed rules
Every slider has a fixed rule: what a billion more or less does, each year up to 2031.
What we leave out
No behaviour, no effect on the economy and no extra interest. Every item shows how certain its amount is.
Free to use. Pro for more.
The dashboard, the rules, the parliamentary papers and sharing are free and stay free.
Free forever
€0
- 25 sliders
- Rules path 2027–2031
- Follow Parliament
- Share plans with a link
Pro per month, excl. VAT
€12
- 209 budget articles
- 78 parameters from the fiscal key table
- Save and compare plans
- Report as PDF and CSV
What people ask us.
- Is this an official calculation?
- No. This is not a calculation by the CPB or the Ministry of Finance. It is an independent tool built on open data.
- How reliable are the numbers?
- The amounts come from the budget. The effects are a simple approximation: without behaviour, the economy or interest. Every item shows whether its certainty is high, medium or low.
- Where do the numbers come from?
- From rijksfinancien.nl, the Tweede Kamer, CBS, the CPB, Eurostat and the European Commission. All sources and licences are on the sources page. To the sources
- What is Keuzes in Kaart?
- At every election the CPB calculates the parties' programmes. We put our rules next to theirs and show where we come out differently.
- Do I need an account?
- No. You only need an account and a subscription for Pro.
- What happens to my data?
- We count visitors without cookies. A shared link only holds the positions of your sliders.

Ready to do the sums?
Open the dashboard and make your own budget. Free, no account needed.